The Average American’s Income Is Unchanged In 30 Years. While The “1%” Have Soared.
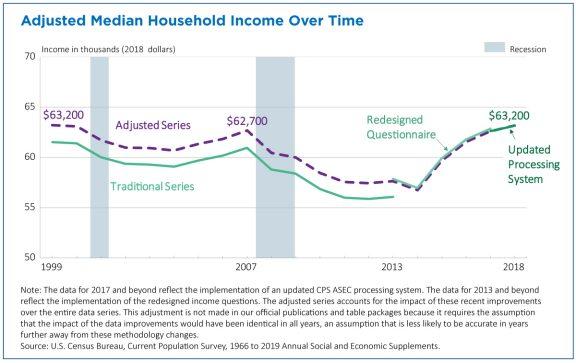
According to the latest Census Bureau figures released this month, real American incomes remained essentially flat in 2018 after three straight years of growth. Median household income was $63,179 in 2018, an uptick of 0.9% that census officials said isn’t statistically significant from the prior year based on figures adjusted for inflation.
The new figures showed that the number of full-time, year-round workers increased by 2.3 million. When looked at by race and ethnicity, median household incomes in America were essentially flat in 2018 for all groups except Asians, who saw theirs rise 4.6% from the previous year in real dollars.
The good news is that while income were flat, the poverty rate in 2018 decline modestly to 11.8%, a decrease of a half percentage point from 2017, marking the fourth consecutive annual decline in the national poverty rate. It was the first time the official poverty rate fell significantly below its level at the start of the recession in 2007.
The bad news is that as with all other government data, how one interprets the data matters, and as the Census Bureau explained in recent weeks, the government revised downward its estimates for job gains, economic output and corporate profits at various points in time since early last year. Previous government surveys had suggested income growth picked up last year. Without dwelling on the nuances, the result is that without the adjustment, income in 2018 is significantly higher than all years shown prior to 2017. However, with the adjustment, it is higher than all the pre-2017 years except 2007, 2000 and 1999.
In other words, median household income in the US is unchanged since 1989!
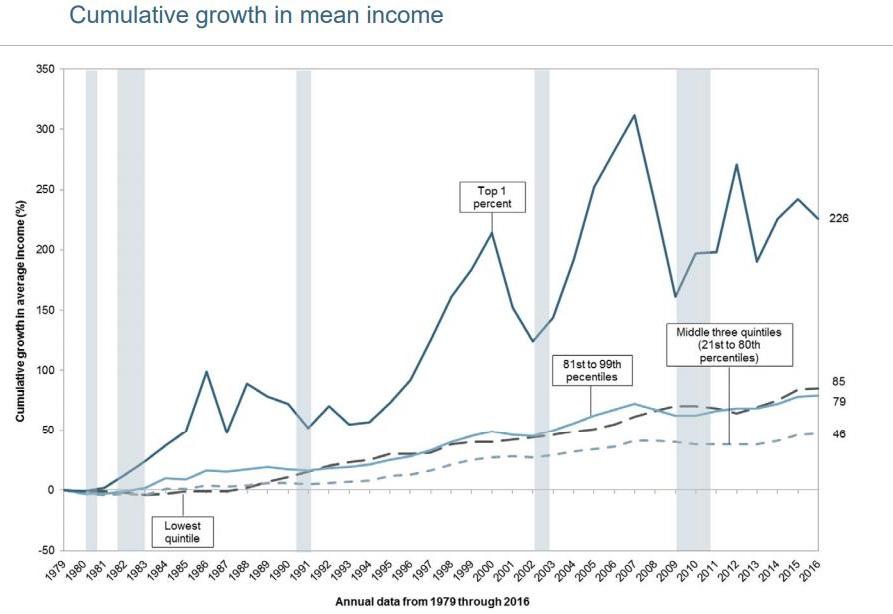
Yet while the average American’s income is unchanged in 30 years, some Americans are more equal than others, and as the following chart breaking down incomes by percentiles and quntiles shows, while most incomes remained stagnant, the incomes for the “Top 1” rose nearly 4x since the late 1980s.

Democratic presidential candidate and Vermont Sen. Bernie Sanders said the figures showed “our rigged system allows billionaires to get richer, while working families struggle to survive.” Note he did not bash millionaires (as he had previously) for the simple reason that he himself is one now.
The report showed little change in the overall distribution of income, but it showed a gain for the second-lowest fifth of all households. The bottom fifth of households—with incomes up to $25,600—accounted for 3.1% of all household income last year. The top fifth of households, which had incomes topping $130,000, collected 52%. The top 5%, with incomes above $248,700, collected 23.1%.
Needless to say, income growth over the past decade hasn’t been as strong as some economists would have expected given the tightness of the U.S. labor market, which in turn has allowed the Fed to cut rates even as the economy continues to hum on all cylinders. The unemployment rate hovered at or below 4% last year.
As the WSJ explains, part of the reason why there has been virtually no income growth in decades, is that employers have become more adept at holding down wages by using technology, and consolidation in industries such as telecommunications and banking also has damped income growth, according to Carl Tannenbaum, chief economist for Northern Trust. The share of workers who are in unions, which push for worker pay raises, also continues to decline steadily.


